Advanced Excel Skills are useful for managing data, preparing reports, analysing information, and making better business decisions. Microsoft Excel is widely used in accounting, banking, sales, marketing, education, administration, data analysis, and many other fields.
Thank you for reading this post, don't forget to subscribe!However, basic Excel formulas may not be enough for many professional tasks. Learning advanced Excel skills can help you work faster, reduce manual errors, and prepare professional reports. These skills are useful for students, job seekers, office employees, business owners, and professionals who want to improve their productivity.
In this blog, we will explore 10 powerful Excel skills to learn in 2026, with simple explanations, practical examples, and guidance on how you can use these skills in your daily work.

Table of Contents
Why Are Excel Skills Important in 2026?
Today, organisations handle large amounts of information every day. They need people who can organise data, calculate results, identify trends, and present information clearly.
Microsoft Excel helps people complete these tasks in an organised way. For example, a sales executive can track monthly sales, an accountant can prepare financial reports, a teacher can manage student records, and a business owner can monitor expenses.
Learning Advanced Excel Skills can help you prepare for roles such as:
- MIS Executive
- Data Analyst
- Accountant
- Sales Coordinator
- Business Analyst
- Operations Executive
- Reporting Executive
- Finance Executive
However, Excel alone does not guarantee a job. Combining practical Excel knowledge with problem-solving, communication, and field-specific skills can improve your career opportunities.a job, but combining it with practical knowledge and problem-solving skills can improve your career opportunities.
1. Advanced Excel Formulas and Functions
Formulas are the foundation of Excel. They help you calculate results automatically instead of doing every calculation manually.
If you want to use Excel professionally, you should understand how to choose the right formula for a particular task.
Important Excel formulas to learn
| Formula | What it does | Practical example |
|---|---|---|
SUMIFS | Adds values that meet multiple conditions | Calculate sales for a particular product and month |
COUNTIFS | Counts records that meet multiple conditions | Count employees in a department |
IF | Returns a result based on a condition | Show Pass or Fail |
IFERROR | Displays an alternative result when a formula produces an error | Replace an error with a clear message |
SUMPRODUCT | Performs calculations using corresponding values in ranges | Calculate total value from quantity and rate |
TEXT | Displays values in a specified text format | Format dates or numbers for reports |
Practical example: Pass or Fail
Suppose a student’s marks are entered in cell B2. You want Excel to display Pass if the marks are 35 or more and Fail otherwise.
Use this formula:
=IF(B2>=35,"Pass","Fail")
If B2 contains 72, Excel displays Pass. If B2 contains 28, Excel displays Fail.
This simple formula can be useful for examination results, employee targets, payment status, and many other tasks.
Where can you use this skill?
You can use advanced formulas in attendance sheets, salary calculations, sales reports, expense tracking, inventory management, and financial reporting.
2. XLOOKUP and Data Searching
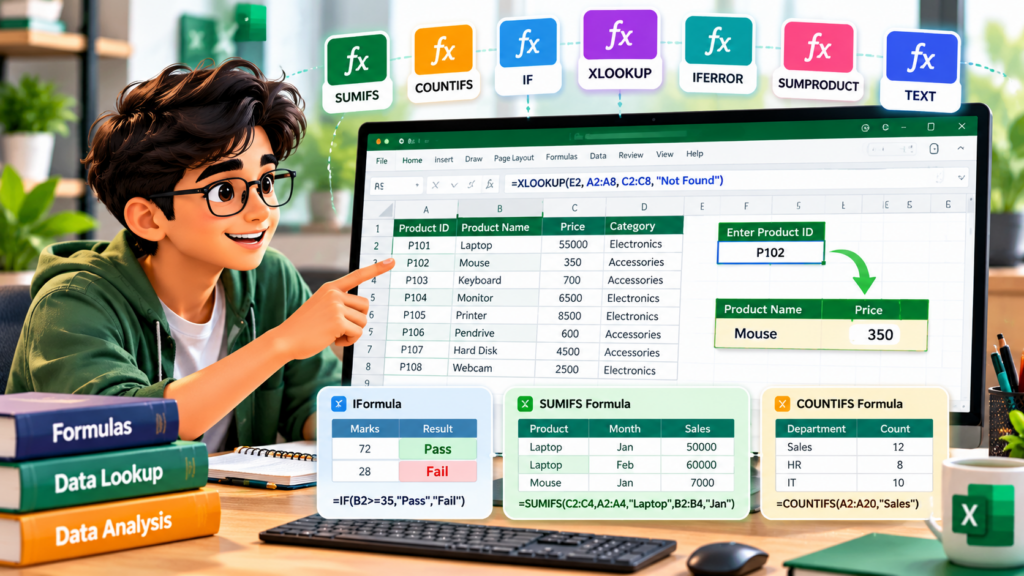
Imagine that you have a list of 5,000 products. Each product has a unique product code, name, category, and price.
If you want to find the price of one product, searching manually can take time. XLOOKUP helps you find the required information automatically.
What is XLOOKUP?
XLOOKUP searches for a value in one range and returns the related information from another range.
For example, your product table contains:
| Product ID | Product Name | Price |
|---|---|---|
| P101 | Keyboard | ₹700 |
| P102 | Mouse | ₹350 |
| P103 | Monitor | ₹6,500 |
If you enter product ID P102, you can use XLOOKUP to find its price.
=XLOOKUP(E2,A2:A4,C2:C4,"Not Found")
Here:
E2contains the product ID you want to search for.A2:A4contains the product IDs.C2:C4contains the prices."Not Found"is displayed if there is no matching product.
The formula returns ₹350 when E2 contains P102.
XLOOKUP can search in different directions and return a value from a separate range. It is often easier to maintain than older lookup formulas. Availability depends on your Excel version.
Where can you use this skill?
- Finding employee details using employee IDs
- Searching product prices
- Matching invoice numbers
- Retrieving student records
- Matching customer information across sheets
3. PivotTables for Quick Data Analysis
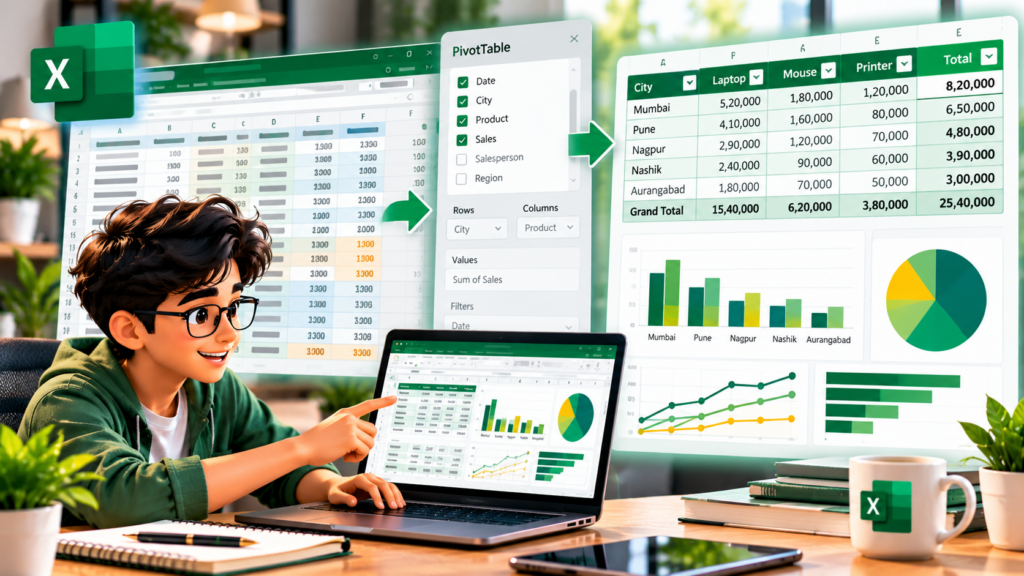
A PivotTable helps you summarise a large dataset without writing a separate formula for every calculation.
Suppose your business has 10,000 sales records containing dates, products, locations, salespeople, and sales amounts.
You want to know:
- Total sales for each product
- Monthly sales
- Sales by city
- Sales by salesperson
A PivotTable can summarise this information quickly.
How does a PivotTable work?
Suppose your data looks like this:
| City | Product | Sales |
|---|---|---|
| Pune | Laptop | ₹50,000 |
| Mumbai | Laptop | ₹60,000 |
| Pune | Mouse | ₹5,000 |
| Mumbai | Mouse | ₹7,000 |
You can create a PivotTable to calculate total sales by city or product.
For example:
| City | Total Sales |
|---|---|
| Pune | ₹55,000 |
| Mumbai | ₹67,000 |
These totals are calculated from the sample records above.
Basic steps to create a PivotTable
- Keep your data in a clean table with clear column headings.
- Click any cell inside the dataset.
- Select Insert → PivotTable.
- Choose where you want the PivotTable to appear.
- Drag the required fields into Rows, Columns, Values, or Filters.
- Change the summary calculation if needed, such as Sum, Count, or Average.
Where can you use this skill?
PivotTables are useful for monthly reports, sales analysis, expense summaries, stock reports, employee data, and business performance analysis.
4. Power Query for Data Cleaning and Automation
One of the most time-consuming tasks in Excel is cleaning data.
You may receive information from different branches, departments, websites, or software systems. The data may contain extra spaces, inconsistent names, blank rows, or different date formats.
Power Query helps you import, clean, combine, and transform data using a repeatable process. https://support.microsoft.com/en-us/excel/about-power-query-in-excel

Example: Combining Monthly Sales Reports
Suppose you receive three separate Excel files:
- January Sales
- February Sales
- March Sales
Each file contains sales information in the same format.
Instead of copying and pasting the data manually, you can use Power Query to combine all three files into one table. This is one of the useful Advanced Excel Skills that can save time when preparing regular reports.
You can also use Power Query to:
- Remove unnecessary columns
- Remove duplicate records
- Split full names into separate columns
- Change data types
- Replace incorrect values
- Combine information from multiple tables
Why Is Power Query Useful?
The biggest advantage of Power Query is that you can reuse the same data-cleaning steps.
After setting up the process, you can often refresh the query when new data becomes available instead of repeating every step manually. However, always check the results after refreshing to ensure that the source data has not changed unexpectedly.
Where Can You Use This Skill?
Power Query is particularly useful for MIS reporting, accounting, data analysis, monthly sales reports, inventory management, and other tasks that involve working with large amounts of data.l for MIS reporting, accounting, data analysis, monthly sales reports, inventory reports, and repetitive office work.
5. Excel Dashboards and Data Visualisation

A dashboard presents important information in one place.
Instead of reading hundreds of rows, a manager can look at a dashboard to understand sales, expenses, targets, and performance.
A professional Excel dashboard may include charts, summary figures, PivotTables, filters, and conditional formatting. https://excel.cloud.microsoft/create/en/dashboards/
What should an Excel dashboard contain?
For a sales dashboard, you might include:
- Total Sales
- Monthly Sales
- Sales by Product
- Sales by Region
- Target Achievement
- Top-Performing Products
For example, a chart can show whether sales increased or decreased over six months. A summary figure can display total sales for the selected period.
Important dashboard skills
Learn how to use:
- Column and bar charts
- Line charts
- PivotCharts
- Slicers and filters
- Conditional formatting
- Summary figures and KPI indicators
- Clear headings and consistent formatting
Tips for creating a professional dashboard
- Decide what information the user needs to see.
- Keep the source data clean and organised.
- Use suitable charts for comparisons and trends.
- Avoid unnecessary colours and decorative elements.
- Make sure the figures are correct and easy to understand.
Where can you use this skill?
Excel dashboards are useful for business owners, sales teams, managers, accountants, MIS executives, and data analysts.
6. Data Validation and Conditional Formatting
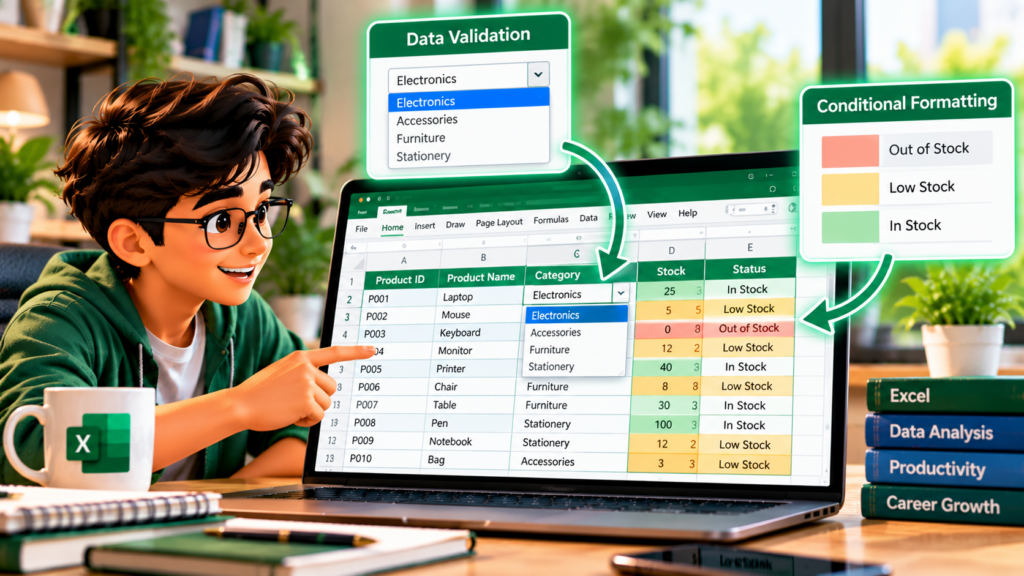
These two features help you maintain better data quality and identify important information quickly.
What Is Data Validation?
Data Validation controls what users can enter into an Excel cell. It helps maintain accurate and consistent data.
For example, suppose you are preparing an employee attendance sheet. You want users to select only Present, Absent, or Leave. You can create a dropdown list containing these three options.
This reduces inconsistent entries such as “P”, “Present”, “present”, and “PR”. Data Validation can also restrict entries based on dates, numbers, and other rules.
What Is Conditional Formatting?
Conditional Formatting automatically changes the appearance of cells when specific conditions are met. It helps you identify important information without checking every row manually.
For example:
- Marks below 35 can be highlighted.
- Overdue payments can be shown in a different colour.
- Sales above a target can be highlighted.
- Low stock quantities can be marked for attention.
Practical Example
Suppose column B contains stock quantities. You want to identify products with fewer than 10 units remaining. You can apply Conditional Formatting to highlight cells where the value is less than 10.
This makes it easier to identify products that may need to be reordered. Learning these features is part of Advanced Excel Skills that help improve data accuracy and make everyday office work easier.
Where Can You Use These Skills?
Use Data Validation and Conditional Formatting in attendance sheets, stock registers, payment trackers, student records, expense reports, and data-entry forms.
7. Dynamic Array Formulas
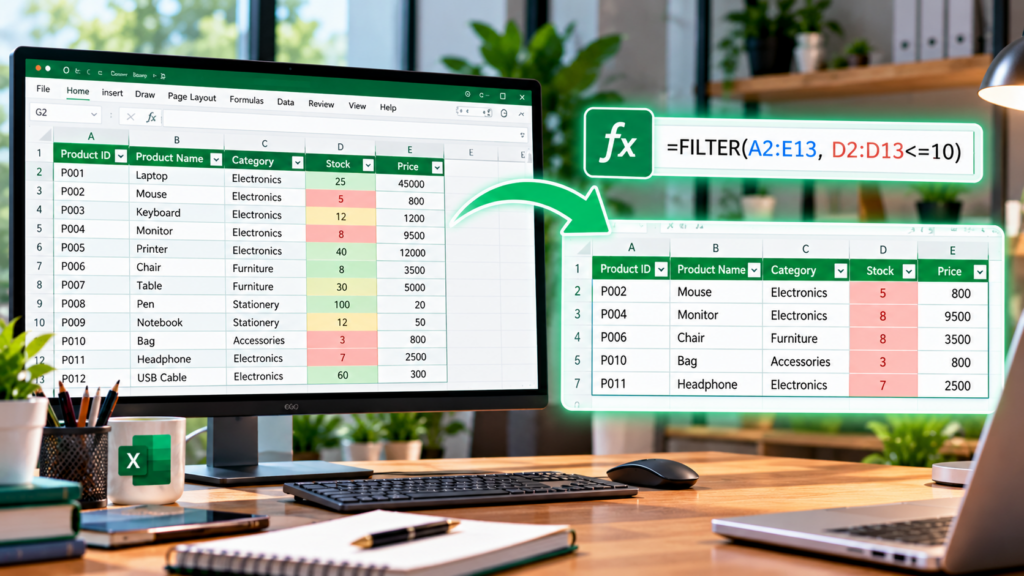
Dynamic array formulas allow a formula to return multiple results that automatically fill neighbouring cells.
This can reduce the need to copy formulas down hundreds of rows.
Some useful dynamic array functions include:
| Function | Purpose |
|---|---|
FILTER | Returns records that meet specified conditions |
SORT | Sorts a range of data |
UNIQUE | Returns distinct values |
SORTBY | Sorts data based on another range |
SEQUENCE | Generates a sequence of numbers |
These functions are available in supported modern Excel versions. Compatibility may vary with older versions. https://support.microsoft.com/en-us/excel/dynamic-array-formulas-and-spilled-array-behavior
Example: Find products with low stock
Suppose column A contains product names and column B contains available stock.
You want to display only products with stock below 10.
Use this formula:
=FILTER(A2:B100,B2:B100<10,"No low-stock products")
Excel returns the matching product names and stock quantities.
When the source data changes, the results can update automatically, provided the formula and source range remain valid.
Where can you use this skill?
Dynamic array formulas are useful for creating live reports, filtered lists, unique customer lists, stock alerts, and automatically updated summaries.
8. Excel Tables and Structured References
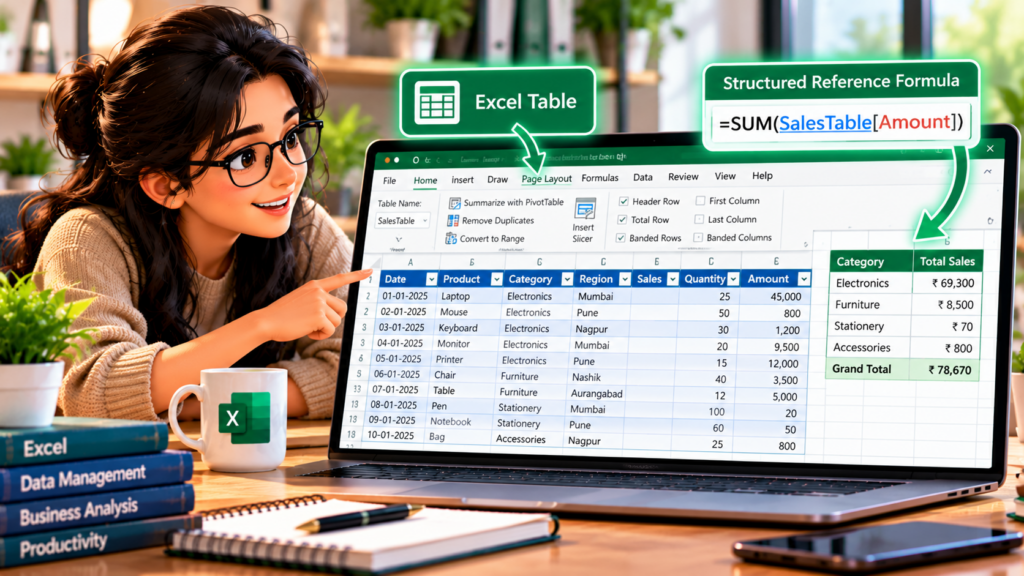
Many users store their information in ordinary cell ranges. However, converting a dataset into an Excel Table can make it easier to manage.
What Is an Excel Table?
An Excel Table is an organised range of data with column headings and built-in features for sorting, filtering, and managing records. It makes your data easier to work with and helps keep your spreadsheet organised.
To create a table:
- Select your data.
- Press
Ctrl + T. - Confirm that your table has headers.
- Click OK.
Why Should You Use Excel Tables?
Excel Tables offer several benefits:
- New rows can become part of the table automatically.
- Filters are available in the column headings.
- Table formatting remains consistent.
- Formulas can fill down automatically in calculated columns.
- Structured references can make formulas easier to understand.
For example, a formula that uses a table column name can be easier to read than one containing many cell references. Using Excel Tables is one of the practical Advanced Excel Skills that helps you manage data and prepare reports more efficiently.
Where Can You Use This Skill?
Use Excel Tables for employee databases, customer lists, sales records, stock registers, purchase records, and expense trackers.
9. Macros and VBA Automation
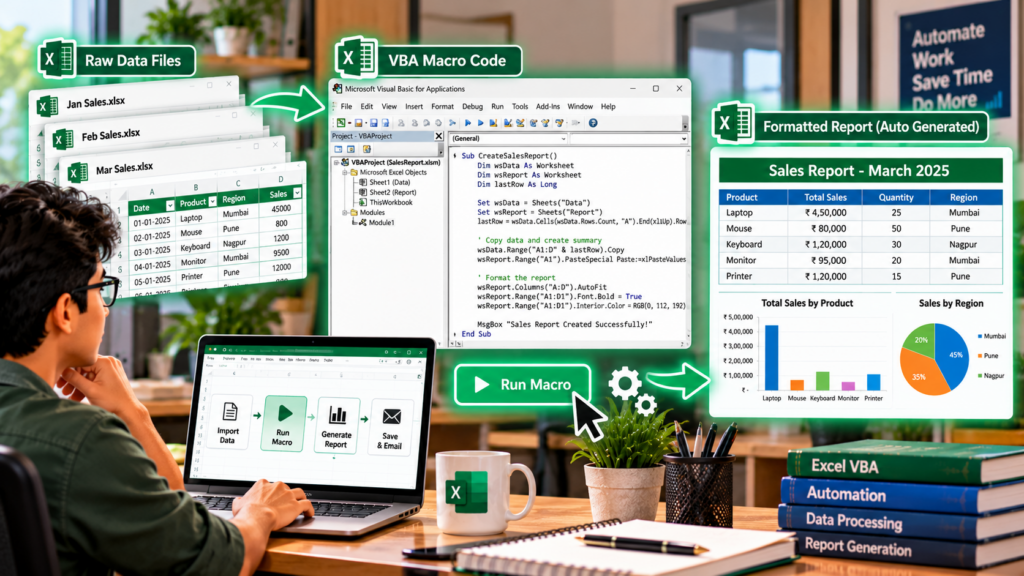
Do you repeat the same Excel task every day?
For example, you may need to format a report, apply borders, adjust column widths, and prepare the same layout every morning.
Macros can help automate repetitive tasks.
What is a Macro?
A Macro records or runs a sequence of actions so that you can repeat them more easily.
For more advanced automation, you can use VBA, which stands for Visual Basic for Applications.
Practical example
Suppose you prepare a daily sales report using the same formatting every day.
You can record a Macro that:
- Applies heading formatting.
- Adjusts column widths.
- Applies number formatting.
- Adds borders to the report.
- Highlights the total row.
You can then run the Macro again when required.
Should beginners learn VBA?
Start with Excel formulas, Tables, PivotTables, and Power Query. Once you understand these features, learn Macros and VBA if your work requires more customised automation.
Important: Only enable Macros in files you trust. Macros from unknown or untrusted sources can contain harmful code.
Where can you use this skill?
Macros and VBA can help with repetitive reporting, formatting, calculations, and customised office workflows.
10. AI-Assisted Excel and Data Analysis
AI tools are becoming an additional way to work with spreadsheets. They can help users understand formulas, explore patterns, and prepare reports.
Some supported Excel experiences include AI-assisted analysis and suggestions. Availability depends on the Excel version, subscription, account, and region. https://support.microsoft.com/en-us/excel/analyze-data-in-excel
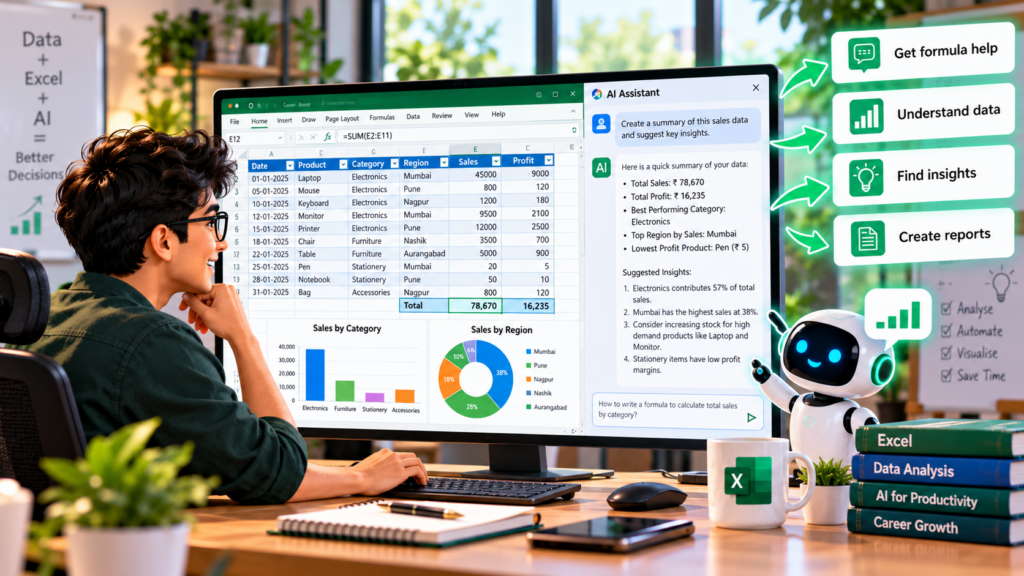
How can AI help with Excel?
You can use an AI assistant to:
- Explain a formula in simple language.
- Help draft an Excel formula.
- Suggest a suitable chart.
- Identify possible trends in a dataset.
- Explain why a formula may be producing an error.
- Suggest ways to organise a report.
For example, you could ask an AI assistant:
“Help me write an Excel formula to calculate total sales for the Mumbai branch in October.”
You should provide clear column names and explain how your data is arranged. The assistant can then suggest a formula for you to test.
Can AI replace Excel skills?
No. AI can assist with some tasks, but you still need to understand your data and check the results.
A formula may be incorrect if the column references, conditions, or data types are wrong. AI-generated reports can also contain errors.
Best approach: Learn Excel fundamentals first, use AI to save time, and verify important calculations before using them in business reports.
Comparison: Which Excel Skill Should You Learn First?
| Your goal | Recommended skill |
|---|---|
| Perform calculations faster | Advanced formulas |
| Search information across tables | XLOOKUP |
| Summarise large datasets | PivotTables |
| Clean and combine multiple files | Power Query |
| Prepare management reports | Dashboards |
| Reduce incorrect data entry | Data Validation |
| Build automatically updated lists | Dynamic arrays |
| Organise large datasets | Excel Tables |
| Automate repetitive tasks | Macros and VBA |
| Get help with formulas and analysis | AI-assisted Excel |
Practical Excel Projects to Build Your Skills
Practical Excel Projects to Build Your Skills
Learning a formula is useful, but applying it to a real task helps you understand it better. These practical projects will help you use Advanced Excel Skills to solve common problems in offices and businesses.
Try building these projects:
Project 1: Monthly Expense Tracker
Create a workbook to record your monthly expenses.
Include:
- Expense date
- Category
- Description
- Amount
- Payment method
- Monthly total
- Category-wise summary
Skills to practise: SUMIFS, Excel Tables, charts, and Conditional Formatting.
Project 2: Sales Performance Dashboard
Prepare a report containing sales data from different products, employees, and cities.
Include:
- Total sales
- Monthly sales
- City-wise sales
- Product-wise sales
- Top-performing employees
- Filters for month and city
Skills to practise: PivotTables, PivotCharts, slicers, and dashboard design.
Project 3: Employee Attendance and Salary Sheet
Create an employee sheet to track attendance and calculate salary based on your defined rules.
Include:
- Employee ID
- Employee name
- Total working days
- Present days
- Leave days
- Salary details
Skills to practise: IF, COUNTIFS, Data Validation, and Conditional Formatting.
Use clear salary rules and verify the calculations before using the sheet for actual payroll.
Project 4: Inventory Management System
Create a workbook to track products, purchases, sales, and available stock.
Include:
- Product ID
- Product name
- Opening stock
- Purchased quantity
- Sold quantity
- Closing stock
- Reorder level
Skills to practise: XLOOKUP, formulas, Tables, and low-stock alerts.
Project 5: Automated Monthly Report
Combine several monthly files, clean the data, and prepare a summary report.
Skills to practise: Power Query, PivotTables, charts, and report formatting.
These projects help you practise Excel in situations similar to those found in offices and businesses. Start with a simple project and gradually add more features as your confidence grows. Focus on accuracy, clear presentation, and practical use rather than simply making the workbook look attractive.
A Simple 30-Day Excel Learning Plan
If you are a beginner or already know basic Excel, use this plan to build your skills step by step.
| Days | What to learn | Practice task |
|---|---|---|
| 1–5 | Basic formulas, cell references, IF, SUMIFS | Create a marks or expense sheet |
| 6–10 | XLOOKUP, COUNTIFS, error handling | Create a product search sheet |
| 11–15 | Excel Tables and PivotTables | Prepare a sales summary |
| 16–20 | Power Query and data cleaning | Combine monthly reports |
| 21–24 | Charts, Conditional Formatting, dashboards | Create a sales dashboard |
| 25–27 | Dynamic arrays and Data Validation | Build an automatic filtered list |
| 28–30 | Macros, AI assistance, revision | Complete one practical project |
Adjust the pace according to your existing knowledge. If you are new to Excel, spend more time practising formulas before moving to automation.
Common Excel Learning Mistakes to Avoid
Many learners watch tutorials but struggle when they need to complete a task independently. Avoid these common mistakes while learning Excel:
- Learning formulas without practising: Create your own sample datasets and apply every formula.
- Ignoring data quality: Incorrect dates, extra spaces, duplicate entries, and inconsistent names can affect your results.
- Memorising without understanding: Learn what each formula does and why you need it.
- Making complicated reports too early: Start with clean tables and accurate calculations before designing dashboards.
- Trusting every result without checking: Verify formulas, totals, filters, and source data.
- Learning only from videos: Try to build complete projects without copying every step from a tutorial.
Regular practice is essential for developing Advanced Excel Skills. Focus on understanding how each feature works and how you can use it to solve real problems.
Frequently Asked Questions (FAQs)
1. Is Excel Still Worth Learning in 2026?
Yes. Excel remains useful for organising information, calculations, reporting, and data analysis. The best results come from combining Excel knowledge with practical skills relevant to your chosen field.
2. Which Excel Skills Are Best for Getting a Job?
Advanced formulas, XLOOKUP, PivotTables, Power Query, dashboards, and data cleaning are useful skills for many office and reporting roles. The exact requirements depend on the job.
3. Can I Learn Advanced Excel in 30 Days?
You can learn and practise several important features in 30 days if you study regularly. However, mastering advanced formulas, automation, and complex reporting usually requires continued practice.
4. Is Excel Useful for People Who Are Not from a Commerce Background?
Yes. Excel is useful for students, teachers, engineers, sales professionals, business owners, administrators, researchers, and many others. You do not need a Commerce background to start learning it.
5. Should I Learn Excel or Power BI First?
If you are new to data analysis, start with Excel fundamentals, formulas, PivotTables, and data cleaning. Then consider Power BI if your work requires interactive reports, data modelling, and larger-scale business intelligence.
6. Do I Need Coding to Learn Advanced Excel?
No. You can learn many advanced Excel features without coding. VBA is useful for certain automation tasks, but it is not required for every advanced Excel workflow.
Conclusion
Excel is more than a tool for entering numbers. When you understand its formulas, lookup functions, PivotTables, Power Query, dashboards, and automation features, you can use it to solve practical problems and prepare better reports.
Learning Advanced Excel Skills can help you work more efficiently, manage data accurately, and prepare for different office and reporting tasks. Start with the skills that match your current needs, practise using sample data, and gradually move towards advanced reporting and automation.
Your next step: Choose one project from this blog and build it yourself. Practical work will help you understand Excel better than simply memorising formulas.
At Knowledge Hunt Computer Academy (KHCA), our aim is to help learners build practical computer skills that they can apply in education, office work, and their careers.
Official Learning Resources
- Microsoft Excel Help and Learning
- About Power Query in Excel
- Microsoft Excel Formula Examples
- Microsoft Learn: Data Analyst Career Path
About Knowledge Hunt Computer Academy
Knowledge Hunt Computer Academy (KHCA) supports learners who want to improve their computer knowledge and practical skills. Keep practising, explore new tools, and focus on learning skills that solve real problems.
Website: https://khca.info/